
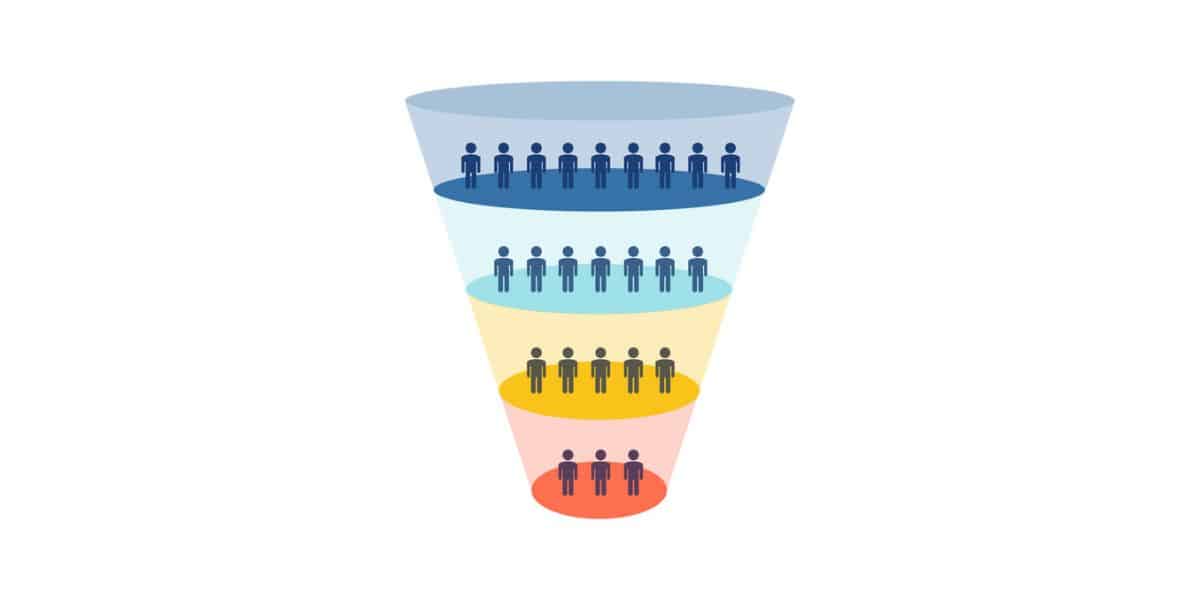
| Short Answer Pipeline coverage is the ratio of your total pipeline value to your revenue quota for a given period. Most sales teams target a 3:1 ratio, meaning you need $3 in qualified pipeline for every $1 of revenue you want to close. Anything below 2.5:1 signals serious risk. Anything above 5:1 usually means your data is dirty or your qualification standards are too loose. |
Key Takeaways
- Pipeline coverage is calculated by dividing your total pipeline value by your quota for the same period.
- The standard benchmark is a 3:1 ratio, but the right number depends on your industry, average sales cycle, and historical win rate.
- A ratio below 2:1 is a near-certain miss. A ratio above 5:1 often hides bad data or inflated opportunity counts.
- Pipeline coverage is a lagging indicator: what you build today shows up in your coverage three to six months from now.
- Digital marketing directly influences pipeline coverage by controlling how many qualified opportunities enter the top of funnel.
- Improving conversion rates, not just deal volume, is usually the faster path to healthier coverage.
Pipeline coverage is one of those metrics that looks simple until someone tries to act on it. The math is straightforward. The interpretation is where most teams get it wrong. Most business owners and executives understand they need a pipeline. Far fewer can tell you whether their pipeline is actually sized correctly to hit quota, and that gap costs them at the end of every quarter.
If you’ve been Googling “what is pipeline coverage” you’re in the right place. This article breaks down the definition, the formula, the benchmarks, and, most importantly, how to fix coverage when it falls short. We’ll also cover how your digital marketing strategy connects directly to your coverage number, because it does, even if your sales team doesn’t always see it that way.
What Is Pipeline Coverage?
Pipeline coverage is the ratio of your total qualified pipeline value to the revenue target you need to hit over the same timeframe. It tells you, in dollar terms, how much opportunity you have available relative to what you need to close.
The formula is simple:
Pipeline Coverage Ratio = Total Pipeline Value / Revenue Quota
So if your sales quota for Q3 is $500,000 and your current pipeline holds $1.5 million in active, qualified opportunities, your pipeline coverage ratio is 3:1. Most organizations consider that the floor, not the target, for a healthy quarter.
The keyword in that formula is “qualified.” Total pipeline coverage only works as a forecasting tool when the deals counted are real, with real decision-makers, real timelines, and real budget. If you’re inflating the number with poorly qualified leads, you’re not measuring coverage. You’re measuring wishful thinking.
How Is Pipeline Coverage Calculated? A Step-by-Step Breakdown
Here’s how to calculate your pipeline coverage correctly:
Step 1: Define your quota. Start with the revenue target you need to hit for the period. This should be your team’s committed number, not a stretch goal.
Step 2: Identify your qualified pipeline. Pull only opportunities that meet your qualification criteria. This is where most teams lose accuracy; make sure you’re not counting dead deals or exploratory conversations.
Step 3: Calculate the ratio. Divide total pipeline value by quota. If you have $2.4M in qualified pipeline against a $800K quota, your ratio is 3:1.
Step 4: Segment by stage. Break your pipeline into early-stage (awareness, discovery) and late-stage (proposal, negotiation, closing). Coverage quality matters as much as total coverage quantity.
Most CRM platforms, including HubSpot, Salesforce, and Pipedrive, can calculate this for you automatically if your deal stages and close dates are maintained accurately. The data hygiene problem is almost always bigger than the math problem.
Pipeline Coverage Ratio Quick Reference
Coverage Ratio | Signal | Likely Outcome | Action Required |
|---|---|---|---|
Below 2:1 | Critical | Quota miss likely | Immediate top-of-funnel investment |
2:1 – 2.9:1 | At Risk | Will depend on conversion rates | Improve lead quality and velocity |
3:1 – 4:1 | Healthy | On track if deals are qualified | Maintain and optimize stages |
Above 5:1 | Inflated | Data quality issue or over-entry | Audit qualification criteria |
How Much Pipeline Coverage Do You Actually Need?
The honest answer: it depends on your win rate. But “it depends” is only useful if you know what it depends on.
The 3:1 benchmark assumes roughly a 33% close rate, meaning one out of every three qualified deals converts to closed revenue. If your historical win rate is 25%, you need 4:1 coverage to hit the same quota. At a 40% win rate, 2.5:1 might be enough. According to Gartner, B2B sales cycles have lengthened significantly over the last several years as buying committees grow and purchase decisions involve more stakeholders. That dynamic pushes required coverage higher, not lower, for most mid-market companies.
There are four variables that determine your specific coverage target:
- Your historical win rate (by deal size, product line, or segment if possible)
- Average sales cycle length
- Deal stage conversion rates
- Quota period length (monthly, quarterly, annual)
One thing worth saying plainly: most B2B companies underprice their pipeline coverage target. They shoot for 3:1, assume it’s safe, and then miss quota because several large deals slipped or churned late. A more conservative, and more accurate, target is 3.5:1 to 4:1 for most mid-market B2B businesses with average sales cycles longer than 45 days.

What Are the Core Components of Pipeline Coverage?
Pipeline coverage isn’t just a single number. It’s built from several underlying components, and each one tells a different story about the health of your revenue engine.
Deal Volume
The number of active opportunities in your pipeline. Volume matters less than quality, but too few deals means even one slip can crater your ratio.
Average Deal Size
If your average deal size is declining, your coverage ratio erodes even if your deal count stays flat. Tracking deal size trends over time tells you whether your pipeline is actually growing in value.
Stage Distribution
A healthy pipeline isn’t all early-stage or all late-stage. An imbalance, say 80% of value sitting in proposal stage, creates a fragile coverage number that looks good until it doesn’t. You want a mix across stages so your forecasting has depth.
Velocity
How fast are deals moving through your pipeline? Deals that stall in a single stage for extended periods inflate your coverage ratio without contributing real revenue probability. Sales pipeline velocity, the rate at which opportunities progress, is worth tracking alongside your coverage ratio. A strong content marketing strategy can keep prospects engaged and moving through stages, particularly in longer B2B cycles.
Lead Quality and Source
Not all pipeline is created equal. Leads generated through high-intent channels like SEO, paid advertising, and referrals often convert at higher rates than outbound-sourced leads. Understanding your coverage by lead source helps you invest marketing spend where it actually builds reliable pipeline.
What Is the Difference Between Pipeline Coverage and Win Rate?
These two metrics are related but measure different things. Understanding the distinction matters when you’re trying to diagnose a coverage problem.
Metric | What It Measures | What It Reveals |
|---|---|---|
Pipeline Coverage | Ratio of pipeline value to quota | Whether you have enough to work with |
Win Rate | % of qualified deals that close | How effective your sales process is |
Deal Velocity | Speed of progression through stages | Where deals stall or drop off |
Forecast Accuracy | How close predictions are to actuals | Quality of pipeline data and CRM hygiene |
Coverage without win rate context is dangerous. A 4:1 coverage ratio with a 15% win rate still misses quota. Win rate with poor coverage means you’re closing deals efficiently but don’t have enough of them to matter. You need both metrics moving in the right direction.
How Does Digital Marketing Affect Pipeline Coverage?
Pipeline coverage is often treated as a sales problem. It’s not, or at least not entirely. Marketing owns the top of the funnel, and what enters the top of the funnel determines what’s available in the pipeline three to six months later.
When marketing generates high-volume but low-quality leads, sales spends time qualifying them out instead of advancing real opportunities. That kills velocity and inflates deal counts without improving pipeline value. According to HubSpot’s State of Marketing Report 2024, companies where marketing and sales share a formal pipeline definition see 36% higher win rates compared to those without alignment.
The levers marketing controls that directly affect pipeline coverage:
- Volume of qualified leads entering the pipeline
- Lead quality by source and channel
- Content that keeps prospects engaged through longer decision cycles
- Retargeting campaigns that recapture stalled or cold opportunities
- Email marketing sequences that nurture leads who aren’t ready to talk to sales yet
In practice, this means your digital marketing strategy should be designed with your pipeline coverage target in mind, not just your traffic or lead volume goals. If your sales team needs a 3.5:1 coverage ratio to hit quota and you’re generating 40 qualified leads per month with a 20% acceptance rate, you can calculate backwards to know what lead volume you actually need to produce.
What Should You Never Do With Pipeline Coverage Data?
A few common mistakes that make coverage metrics misleading or outright useless:
Count unqualified opportunities. If a contact filled out a form but hasn’t confirmed budget, authority, or interest, that’s not pipeline. Counting it as pipeline inflates your ratio and gives false confidence.
Ignore stage-weighted probability. A $500K deal at the first discovery call is not the same as a $500K deal at final contract review. Using weighted pipeline, where each deal’s value is discounted by stage probability, gives you a more accurate picture of expected revenue.
Review it only at quarter-end. Pipeline coverage is a leading indicator. Reviewing it weekly or bi-weekly gives you time to act. By the time you’re looking at it at end-of-quarter, it’s too late to move the number meaningfully.
Treat all lead sources the same. Pipeline sourced from your top-performing organic content or from a referral closes at a very different rate than pipeline from a cold list. Source-level tracking gives you a more accurate coverage picture, and tells you where to invest next.
What Changed in Pipeline Coverage Benchmarks in 2025 and 2026?
A few things have shifted meaningfully:
Longer sales cycles require higher coverage. B2B buying committees have grown. More stakeholders mean more approval layers, more risk aversion, and slower deal progression. Companies that were comfortable with 3:1 coverage five years ago are building toward 4:1 targets now.
AI-influenced search is changing how leads enter pipelines. As more buyers use AI tools to research vendors before ever contacting a sales team, the awareness and consideration stages are happening off your radar. That means by the time a prospect enters your pipeline, they’re often further along, but the total lead volume from traditional discovery channels has dropped. This is another reason why AI visibility and search optimization is becoming a pipeline issue, not just a marketing metric.
CRM hygiene matters more than ever. With more automated lead entry and AI-assisted prospecting, poor data hygiene spreads faster. Coverage ratios built on outdated close dates, duplicate contacts, or improperly staged deals will produce forecasts that miss consistently.
How Can You Improve Pipeline Coverage When It Falls Short?
If your coverage ratio is below your target, you have two levers: increase pipeline volume or improve conversion rates through the funnel. Realistically, you need to pull both.
Increase Top-of-Funnel Volume
The most direct path is generating more qualified leads. Paid advertising campaigns targeted at your ideal customer profile can produce volume quickly. SEO and content marketing build sustainable pipeline over time. The key distinction: you don’t want leads. You want qualified leads that your sales team will actually accept. Unqualified volume makes your coverage ratio look good while your quota miss percentage climbs.
Improve Stage Conversion Rates
If you’re converting 20% of discovery calls to proposals and 30% of proposals to close, improving your discovery-to-proposal rate by 10 percentage points has a larger pipeline impact than adding new leads. Review where deals drop off and address the friction there, whether it’s sales process, content gaps, or qualification criteria. See our post on 10 elements of an effective marketing strategy for more on aligning tactics to stages.
Shorten Your Sales Cycle
Faster pipeline velocity means each lead produces revenue sooner, and your existing pipeline covers more of your quota per period. Case studies, ROI calculators, and strong social proof reduce the length of the evaluation phase for buyers who are already interested.
Re-Engage Stalled Opportunities
Every sales pipeline has deals that have gone quiet. A structured reactivation campaign, typically through email or paid retargeting, can revive a meaningful percentage of those stalled opportunities and add recovered pipeline without any new acquisition cost. This is one of the fastest wins in coverage improvement, and it’s often overlooked.
Is Pipeline Coverage Worth Tracking for Small Businesses?
Yes. The math works at any deal volume. If you’re closing 10 deals per quarter with an average deal size of $15,000, your quota is $150,000 and you need $450,000 in qualified pipeline to feel confident. That’s still a real number worth tracking, and it tells you whether your current marketing and sales activity is sized for your revenue goals.
The argument against tracking it, “we’re too small,” usually reflects discomfort with the answer, not a logical exemption. Small businesses that don’t track coverage tend to run quarter-to-quarter in reactive mode, never quite sure why some quarters hit and others miss. Coverage is the diagnostic that removes the guesswork.
Frequently Asked Questions About Pipeline Coverage
What is a good pipeline coverage ratio?
A good pipeline coverage ratio is generally 3:1, or $3 in qualified pipeline for every $1 of quota. However, the right ratio depends on your win rate, sales cycle length, and deal stage distribution. Companies with win rates below 25% or sales cycles longer than 60 days should target 4:1 or higher to account for slippage and deal velocity.
What is pipeline coverage in simple terms?
Pipeline coverage tells you whether you have enough potential deals in progress to realistically hit your sales target. If your goal is to close $200,000 this quarter and your pipeline holds $600,000 in active, qualified opportunities, your coverage is 3:1. It’s a confidence measure, not a guarantee; the quality of those deals determines whether the number is real or inflated.
How often should pipeline coverage be reviewed?
Pipeline coverage should be reviewed at least weekly, not just at quarter-end. Weekly reviews give sales and marketing teams time to respond, whether by accelerating high-priority deals, reactivating stalled ones, or increasing lead generation investment where the pipeline is thin. Monthly reviews are the minimum acceptable cadence for most businesses.
What causes low pipeline coverage?
Low pipeline coverage is almost always caused by one of three things: insufficient lead volume entering the top of funnel, poor lead quality that causes sales to disqualify most incoming opportunities, or high deal drop-off rates at a specific stage. Diagnosing which of these is primary determines whether the fix sits with marketing, sales process, or both.
Can marketing help improve pipeline coverage?
Yes, marketing is one of the primary drivers of pipeline coverage. Lead generation, SEO, content, and paid advertising all control the volume and quality of opportunities that enter the pipeline. When digital marketing and sales share a definition of a qualified lead and a pipeline coverage target, both teams operate with shared accountability for the revenue number.
What is the difference between pipeline and forecast?
Pipeline is all active opportunities currently being pursued. Forecast is a subset of pipeline: the deals your sales team expects to close within a specific period with high confidence. Pipeline coverage measures total pipeline against quota. Forecast accuracy measures how close your committed forecast is to actual closed revenue. You need both to understand your revenue health.
How does sales cycle length affect required pipeline coverage?
The longer your average sales cycle, the higher your required coverage ratio. If deals take 90 days to close, the opportunities you’re counting in your current pipeline may have entered weeks or months ago, and some will fall out before they convert. A 90-day cycle typically requires 4:1 coverage or more to account for deal slippage compared to a 30-day cycle that might be manageable at 2.5:1.
Ready to Build a Pipeline That Actually Hits Quota?
Pipeline coverage isn’t a number to track after the quarter ends. It’s a signal you manage in real time, and it starts with the quality of marketing activity feeding your top of funnel. If your coverage is consistently below target, the fix usually isn’t pushing sales harder. It’s aligning your digital marketing strategy to generate the right leads at the right volume.
At THAT Agency, we help growth-focused businesses build scalable marketing systems that drive qualified pipeline, not just traffic. Contact us to talk about your pipeline coverage goals and how we can help you close the gap.